Quick Answer
tl;dr: Google LSA analytics show which leads Google charged you for and how often your ad appeared. Charged leads are not booked jobs, and impression rates describe placement when your ad was shown. Match those leads with net ad spend, booked jobs and collected revenue to measure cost per booked job and return on ad spend.
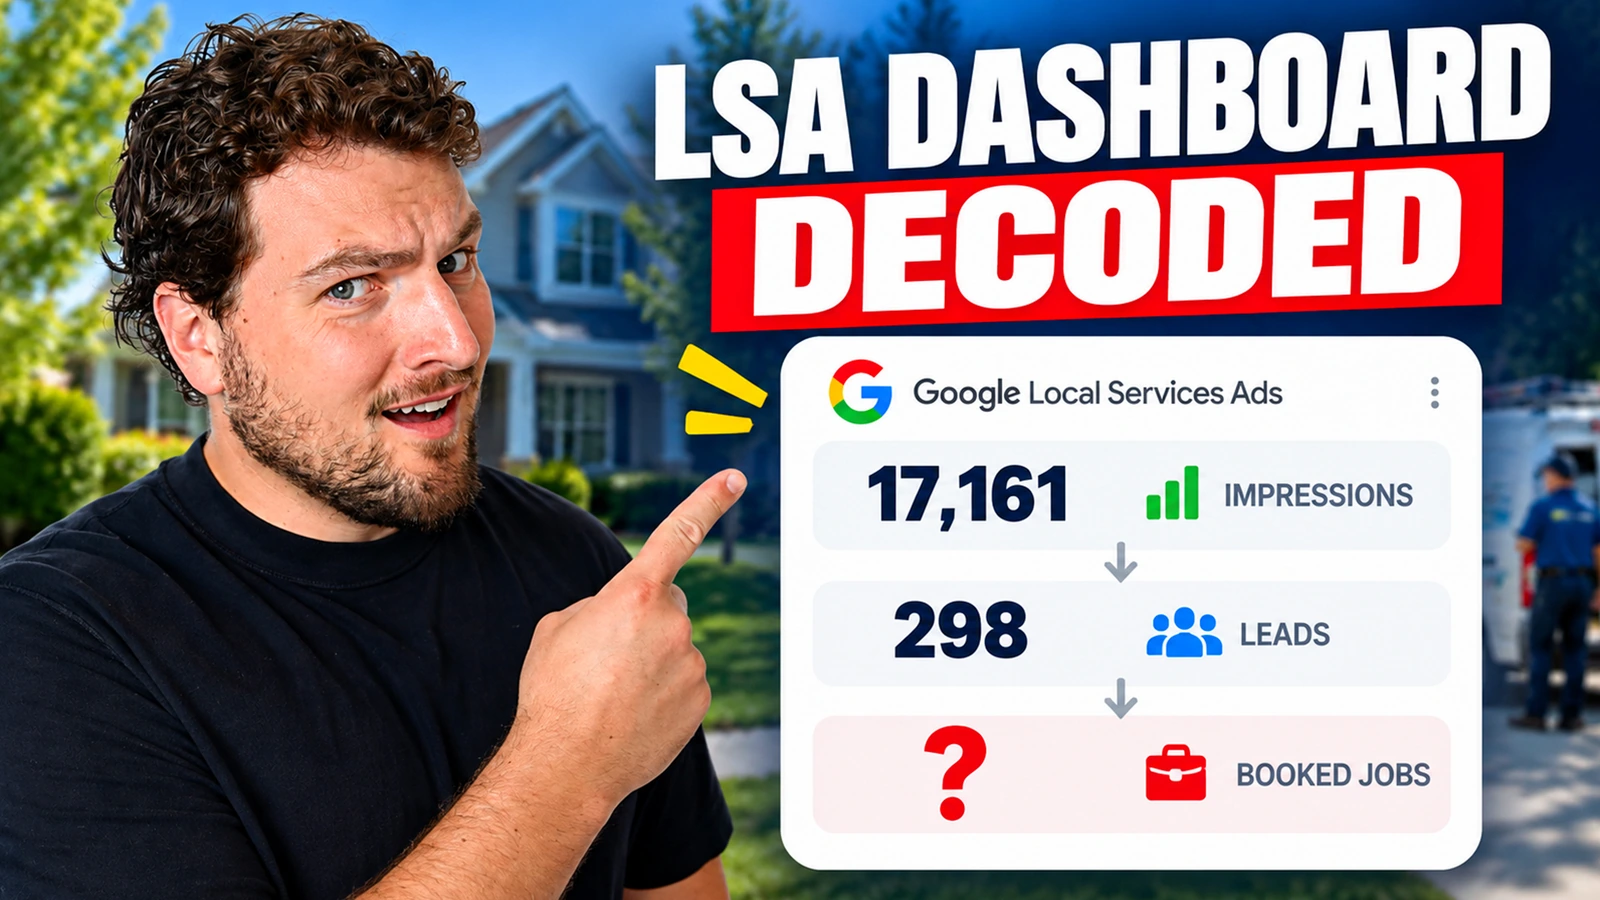
As you log in to your Google Local Services Ads dashboard, you see 298 leads for the month. That sounds great. Then you glance at your calendar, and it doesn’t seem like 298 jobs.
That’s because the Google LSA analytics overview shown here tracks two things: the leads Google billed you for and the number of times your ad was displayed. Both matter. However, neither one tells you if your ads generated profits.
Let’s explore a real LSA dashboard, one line at a time, to understand what each metric measures for your business and what additional numbers you need to get the big picture. This Google LSA reporting walkthrough is for home service owners, including HVAC, plumbing and roofing contractors.
Watch the video below for a quick tour from Bryan Shankman, co-founder and CEO of LeadTruffle, or continue reading for the full breakdown.
What Your Google LSA Analytics Actually Show
Here are the key LSA dashboard metrics. The examples are from a real account covering September 9 to October 8, 2026. Google’s Local Services Ads reporting guide explains where to find reports.
| Metric | What it means | What it does NOT mean | Example |
|---|---|---|---|
| Charged leads | Calls and messages Google billed you for | Booked jobs or paying customers | 298 (207 phone, 91 message) |
| Booking leads | Leads received via LSA’s “Book now” feature | The number of jobs you have booked. | 0 |
| Non-charged leads | Leads Google recorded without charging you | Refunds you have received for leads obtained in the past | 50 (all phone) |
| Ad impressions | The number of times your ad was displayed. | Unique people reached or calls received | 17,161 |
| Top impression rate | Share of impressions shown above the regular (unpaid) results | Your share of all relevant searches | 95% |
| Absolute top impression rate | Share of impressions where your ad was the very first ad | A separate number to add to the top rate | 30.89% |
Now let’s go through each one.
Start With the Date Range
Before you consider anything else, always look at the date range on top of the dashboard first. Each number on the screen is only valid during that time.
Compare results over similar time frames, such as this week with last week or this month with last month. If you’re checking early in the day, keep in mind that today’s numbers aren’t complete yet.
Charged Leads Are What You Paid for, Not What You Booked
LSA charged leads are the leads Google billed you for. In our example account, that number is 298.
This is the number that most owners miss. A charged lead is a billing record. It will not tell you if that person became a customer. “Was I charged for this lead?” and “Did this lead become a job?” are two different questions.
Phone Leads vs. Message Leads
The dashboard separates charged leads by how people contacted you. In our example, there were 207 phone leads and 91 message leads, so about 69% called and 31% sent messages.
That split tells you how your team needs to be set up. If nearly one-third of your leads come in as messages, somebody (or something) has to respond promptly. An LSA autoresponder can reply within seconds, even after hours. For a practical setup, see how to automate Google LSA message replies with Zapier and AI.
Why “0 Booking Leads” Doesn’t Mean You Booked Zero Jobs
Our example shows zero booking leads. That means no leads came through the direct “Book now” option during this period. It does not prove the feature is disabled or that you booked zero jobs. The breakdown describes how leads came in. Google explains how booking leads work and which accounts can use the feature.
Someone who calls or messages can still book a job. That outcome won’t change their lead type to a direct booking lead. You can mark leads as booked in your LSA inbox where that feature is available, and track actual booked jobs in your CRM or job management system.
Non-Charged Leads vs. Credited Leads
When you change the overview card to “non-charged leads” our example displays 50 phone calls. A non-charged lead is a lead that Google did not charge from the beginning.
That’s different from a lead you were charged for and later credited. Google’s automated lead credits can apply after a charged lead is reassessed. The total will not tell you why each lead wasn’t charged or whether any became a customer. To find out, open the individual lead details.
Ad Impressions Are a Visibility Number
Our example account’s ad was displayed 17,161 times during the period. Each appearance counts as an LSA ad impression, including repeat appearances to the same person.
Remember to keep two things in mind:
- It’s not the number of different people. Your ad may be viewed 10 times by one person.
- It doesn’t imply that anyone called, clicked or sent a message.
Consider impressions as the opening of the story. They tell you how visible you were. Your lead numbers tell you how many people reached out. To know what that visibility produced, you still need to track leads and booked jobs.
You can calculate a simple lead-to-impression ratio yourself: charged leads ÷ impressions × 100. In this example, 298 ÷ 17,161 × 100 is about 1.74%. This is a charged-lead ratio, not a click-through rate or a booked-job conversion rate, and it excludes non-charged leads.
Top Impression Rate vs. Absolute Top Impression Rate
The two numbers that are likely to be the most puzzling in LSA. Here’s the difference:
| Top impression rate | Absolute top impression rate | |
|---|---|---|
| What it measures | The percentage of times people saw your ad above the natural (unpaid) search results. | Share of impressions where your ad appeared first, in the No. 1 slot |
| Example | About 95 of every 100 impressions were above the unpaid results, which is 95% | 30.89%, so about 31 of every 100 impressions were in the #1 slot |
| How to judge it | Compare with your own history; 95% is this account’s example | Compare with your market and outcomes; 30.89% is this account’s example |
Here are some points you should be aware of:
- Do not add them together. Absolute top impressions are already included in top impressions.
- Top rate is not your share of all searches. A 95% top impression rate doesn’t mean you appeared in 95% of relevant searches. It only describes where your ad appeared when it was shown.
- Placement isn’t profit. A high placement rate is an indicator of how you’re presenting yourself on Google. It doesn’t reveal whether those leads became successful jobs.
What’s a good top impression rate?
A high top impression rate means most of your impressions appeared above the unpaid results. Use the video’s suggested 90% as a working reference, not a Google benchmark or a guarantee of results. Compare it with your own history, lead volume and cost per booked job.
What helps your absolute top impression rate?
Absolute top impression rate depends on market competition and Google’s ad auction. Profile improvements that can help include:
- More reviews and a strong review rating
- High-quality photos on your profile
- Accurate, complete profile information and required verification
Your bid, responsiveness, and relevance to the services and areas searched also matter. Google’s explanation of ad rankings covers these factors. If collecting reviews is the bottleneck, see how to automate Google review requests in Jobber.
How to Read the Charged Leads Graph (and the Zero Days)
The “charged leads received” graph shows daily increases and decreases in charged leads. Some days bring in more than others. You may also see days that drop to zero.
The patterns are interesting to explore, but a graph will not give you the reason. Before declaring that something is broken:
- Check your ad schedule against the dates.
- Review the status of your campaign for those days.
- Review your budget history.
- Look across several weeks, not just one quiet day.
Keep in mind, this is a graph of charged leads. A zero is not a sign of inactivity, but rather it is a sign of zero charged leads that day. You might still have been able to have a lot of impressions and even some non-charged leads.
Identify good questions by using the graph. Then go through your account information to discover the answers.
The Numbers Your LSA Dashboard Leaves Out
The overview shown in this video does not pair these metrics with job outcomes. Google’s Local Services Ads reports can show total lead spend and credits, and you can mark leads as booked where supported. You still need completed-job revenue and costs to judge profitability.
You will need three additional numbers for the same lead cohort and date range:
- What you spent
- How many of those leads became booked jobs
- The amount of money the jobs generated
Thereafter, the math is easy:
| Number | How to calculate it | What it tells you |
|---|---|---|
| Cost per charged lead | Net ad spend ÷ charged leads | The price of each lead you pay for |
| Booking rate | Booked jobs from charged leads ÷ charged leads × 100 | The percentage of paid inquiries that become booked jobs |
| Cost per booked job | Net ad spend ÷ booked jobs from those charged leads | The true expense of getting a job. |
| Return on ad spend | Revenue from those jobs ÷ net ad spend | Revenue generated per dollar of ad spend, not profit |
A hint: treat lead credits consistently whenever you compare periods. If you subtract credits from ad spend one month, use the same approach every month. Match bookings and revenue to the leads that generated them; recent leads may still be waiting to book.
For a rough planning estimate by trade, LeadTruffle’s Google LSA cost calculator can provide a starting point. Use your own recent LSA cost per lead when judging actual performance.
It’s often hardest to track what happened after each inquiry. The simplest solution is to keep LSA leads and job outcomes together in your CRM, with the lead source recorded. Track the inquiry, booking, completed job and collected revenue so your cost per booked job uses the right leads.
After tracking outcomes, you will know which lever to pull:
- Not enough leads? Continue work on visibility and placement.
- Many leads and not enough jobs? Review response speed, lead quality and follow-up before increasing your ad budget.
- Leads stall after first contact? Continue following up to improve your LSA booking rate. These AI lead response workflows explain how qualification, booking and follow-up fit together.
Read Your LSA Results as a Journey
Google LSA analytics can be broken down into four steps in the simplest terms:
- Impressions: the number of times your ad was displayed
- Leads: how many people reached out by phone, message or direct booking
- Booked jobs: how many inquiries became appointments
- Revenue: what those completed jobs brought in
The overview helps with the first two steps. Booked-job tracking adds the next step, and your CRM or accounting records supply revenue. Measure each stage to see where you’re losing opportunities and what to improve.
FAQs
What is a charged lead in Google LSA?
A charged lead is a call, message or direct booking from a potential customer that Google billed you for. It is a billing record, not proof of a completed job. Track whether each charged lead became a customer in your CRM.
What is the difference between a charged and non-charged lead?
A non-charged lead is one Google did not charge you for from the outset. A charged lead was billed. A credited lead was billed first and credited later, including through Google's automated reassessment.
What does top impression rate mean in Local Services Ads?
Top impression rate is the share of your ad's impressions that appeared above the regular, unpaid search results. It describes placement when your ad showed, not your share of all relevant searches.
What is a good absolute top impression rate for LSA?
There is no universal rate that guarantees good results. In the video, Bryan treats roughly 30% as a strong working reference; it is not a Google benchmark. At 30.89%, this account's ad appeared first on about 31 of every 100 impressions. Judge that alongside booked jobs and acquisition cost.
How do I increase my absolute top impression rate?
Think about the positive elements of your profile for Google:
- Get more reviews and maintain a strong rating
- Add good photos
- Keep your profile accurate and complete
- Respond promptly, check verification requirements, and review your bid and budget
Why are my LSA charged leads dropping to zero on some days?
A zero on the graph means there were no charged leads that day, not necessarily no activity. Check your ad schedule, campaign status and budget history for those dates. Compare several weeks to separate a recurring issue from a quiet day.
How do I calculate Google LSA cost per lead?
Divide net ad spend by the number of charged leads for the same period. For example, $3,000 ÷ 100 charged leads is $30 per lead. To calculate cost per booked job, divide that same spend by the booked jobs generated by those leads.
Does Google LSA show how many jobs I booked?
The "booking leads" count refers to leads from the direct "Book now" option, not all jobs you booked from calls and messages. You can manually mark leads as booked in the LSA inbox where supported. Keep your CRM up to date for completed jobs and revenue.
See the Whole Picture in One Place
The LSA overview shown here is a great place to begin, but it doesn’t connect leads with completed-job revenue. You’ll need to pair the numbers with revenue, booked jobs, and the amount spent to determine if Google LSA is indeed working for you.
Start with a weekly review: compare charged leads, net ad spend, booked jobs and collected revenue for the same group of inquiries. That gives you a useful next step, whether it’s improving visibility, responding faster or fixing follow-up.
Want more practical breakdowns like this?
If this kind of breakdown is useful, I send one of these every week. Join the newsletter and I'll walk you through the next one.